Showing posts with label Performance Tuning. Show all posts

Thursday, August 19, 2010

SQL Server Parameter Sniffing

Today on the MSDN TSQL forums I was asked about a performance problem and to me the problem seemed to be directly related to parameter sniffing.  The poster then stated that he is not using stored procedures, so it cannot be a parameter sniffing .  Truth be told there are a lot of misconceptions surrounding parameter sniffing.  The best way to understand parameter sniffing is to understand why it happens. 

Parameter sniffing occurs when a parameterized query uses cached cardinality estimates to make query plan decisions.  The problem occurs when the first execution has atypical parameter values.  For each subsequent execution the optimizer is going to assume the estimates are good even though the estimates may be way off.  For example, say you have a stored procedure that returns all id values between 1 and 1000.  If the stored procedure is executed with this large range  of parameter values, the optimizer is going to cache these atypical values, which indirectly causes the optimizer to under estimate cardinality.  The problem is a typical execution may only return a few rows.  This “sniffing” can cause queries to scan a table oppose to seek because the optimizer is assuming inaccurate cardinality estimates.  The easiest way to tell if this problem is occurring in your environment, is to look at the query plan XML. Inside the query plan XML, you will see something similar to the code snippet below:

<ColumnReference Column="@1" ParameterCompiledValue="(1000)" ParameterRuntimeValue="(10)" />
<ColumnReference Column="@0" ParameterCompiledValue="(1)" ParameterRuntimeValue="(1)" />

In the snippet above, the query plan is assuming that column@1 has a value of 1000 and column @0 has a value of 1, while the actual runtime values are 10 and 1 respectively. 

There are three different methods to incorporate parameterization in SQL Server, auto/simple parameterization, stored procedures, and dynamic TSQL (executed with sp_executesql).  One of the most common misconceptions I have seen surrounding parameter sniffing is thinking that it is limited to stored procedures.   Now that we know more about parameter sniffing, lets have a look at an example.  I will be using the AdventureWorks database for my example.  In this example, I will select a few rows from the Sales.SalesOrderHeader table and then issue the same query, but return a lot more rows.

Code:

SELECT * FROM Sales.SalesOrderHeader WHERE CustomerID between 1 and 10
SELECT * FROM Sales.SalesOrderHeader WHERE CustomerID between 1 and 500

Query Plan:

image

As you can see, the query plan changes based on the number of rows returned.  The reason being is in this case is the optimizer hit a tipping point where the cost of the key lookup is greater than an index scan.  Let’s see what happens when a parameter sniffing problem occurs.

DBCC freeproccache
GO
EXEC sp_executesql N'SELECT * FROM Sales.SalesOrderHeader WHERE CustomerID between @Start and @End;',N'@Start INT,@End INT',@Start=1,@End=500
GO
EXEC sp_executesql N'SELECT * FROM Sales.SalesOrderHeader WHERE CustomerID between @Start and @End;',N'@Start INT,@End INT',@Start=1,@End=10
GO

Query Plans:

image

The execution plans are identical for both queries even though the number of rows greatly decreased.  This is a parameter sniffing problem. This problem occurs because we executed and cached the atypical execution that is returning customerid values between 1 and 500.  We can look into the execution plan and see the compiled parameter values and we can look at the execution plan estimated rows to validate.

<ColumnReference Column="@End" ParameterCompiledValue="(500)" ParameterRuntimeValue="(10)" />
<ColumnReference Column="@Start" ParameterCompiledValue="(1)" ParameterRuntimeValue="(1)" />

What can you do to solve the parameter sniffing problem?  You have a few options that you can use to solve the parameter sniffing problem.  You can use a local variables, this makes the optimizer use the density of the table to estimate cardinality, option recompile, or use the optimize for hint. 

--Declare local variables
EXEC sp_executesql N'declare @dynStart INT,@dynEnd INT; SET @dynStart=@Start; SET @dynEnd=@End;SELECT * FROM Sales.SalesOrderHeader WHERE CustomerID between @dynStart and @dynEnd;',N'@Start INT,@End INT',@Start=1,@End=500
EXEC sp_executesql N'declare @dynStart INT,@dynEnd INT; SET @dynStart=@Start; SET @dynEnd=@End;SELECT * FROM Sales.SalesOrderHeader WHERE CustomerID between @dynStart and @dynEnd;',N'@Start INT,@End INT',@Start=1,@End=10

--Solution Using option(recompile)
EXEC sp_executesql N'SELECT * FROM Sales.SalesOrderHeader WHERE CustomerID between @Start and @End OPTION(RECOMPILE);',N'@Start INT,@End INT',@Start=1,@End=500
EXEC sp_executesql N'SELECT * FROM Sales.SalesOrderHeader WHERE CustomerID between @Start and @End OPTION(RECOMPILE);',N'@Start INT,@End INT',@Start=1,@End=10

--Solution Using OPTIMIZE FOR HINT
EXEC sp_executesql N'SELECT * FROM Sales.SalesOrderHeader WHERE CustomerID between @Start and @End OPTION(OPTIMIZE FOR (@Start=1,@End=10));',N'@Start INT,@End INT',@Start=1,@End=500
EXEC sp_executesql N'SELECT * FROM Sales.SalesOrderHeader WHERE CustomerID between @Start and @End OPTION(OPTIMIZE FOR (@Start=1,@End=10));',N'@Start INT,@End INT',@Start=1,@End=10

--Solution Using OPTIMIZE FOR UNKNOWN (SQL 2008 only)
EXEC sp_executesql N'SELECT * FROM Sales.SalesOrderHeader WHERE CustomerID between @Start and @End OPTION(OPTIMIZE FOR (@Start UNKNOWN,@End UNKNOWN));',N'@Start INT,@End INT',@Start=1,@End=500
EXEC sp_executesql N'SELECT * FROM Sales.SalesOrderHeader WHERE CustomerID between @Start and @End OPTION(OPTIMIZE FOR (@Start UNKNOWN,@End UNKNOWN));',N'@Start INT,@End INT',@Start=1,@End=10

Now each of the above methods will help alleviate some of the problems associated with parameter sniffing, but that does not mean it will give you an optimal query plan.  You should test each of the methods to see which makes the most sense for your environment.  If none of these options perform well, another option is to use control flow logic to execution different variations of the TSQL or stored procedure, allowing for more control over which execution plan gets used.  The thing to remember here, is you have to cater to your customers and their usage patterns to ultimately decide which solution is best for your environment.

Until next time happy coding.

Friday, June 11, 2010

Why Are Transactions Blocked All Of A Sudden?

Have you ever had a query that runs perfectly fine one day and the then all of a sudden starts getting bombarded with blocking transactions?  Believe it or not this is not than uncommon an occurrence and more interestingly can occur when no changes occur in the schema at all!  Unbeknownst to most, you are susceptible to an imaginary data distribution tipping point that can go south at any point in time, if your application creates a specific type of workload.   Let’s dig deeper to find out what causes this problem.

I will start off by creating some sample data.

USE [tempdb]
GO
IF EXISTS(SELECT 1 FROM sys.tables WHERE NAME = 'TestData')
BEGIN
    DROP TABLE dbo.[TestData];
END
GO

CREATE TABLE dbo.TestData(
RowNum INT PRIMARY KEY CLUSTERED,
SomeBit INT,
SomeCode CHAR(2)
);
GO

INSERT INTO dbo.TestData
SELECT TOP 5000 
    ROW_NUMBER() OVER (ORDER BY t1.NAME) AS RowNumber,
    CASE WHEN ROW_NUMBER() OVER (ORDER BY t1.NAME) %5 = 0 THEN 1 ELSE 0 END AS SomeBit, 
    'A' AS SomeCode
FROM 
    Master.dbo.SysColumns t1,
    Master.dbo.SysColumns t2
GO

Nothing new here, just a table with some data.  Now I will begin a transaction and run a simple UPDATE statement.

BEGIN TRANSACTION

UPDATE dbo.TestData
SET SomeCode = 'B'
WHERE somebit = 0

Now run a simple select statement against the table in a new query window.

SELECT RowNum FROM dbo.TestData WHERE RowNum = 1000

/*
RowNum
-----------
1000
*/

The query returned a resultset, just as we thought it would.  What I wanted to show here is that we currently do not have a blocking problem and users can still access the rows that do not have a SomeBit value of 0.   SQL Server will try to take the lowest or most granular lock possible when satisfying a query, such that other queries can still do what they need to.  Obviously there are limitations to this and SQL Server reacts differently based on system responsiveness and pressures.    You can verify that you cannot access a row with a SomeBit value of 0 by changing the predicate to a number that is not divisible by 5.

Okay…. big deal…. you probably already know this, but lets suppose that your manager tells you to migrate data from an existing system into this table.    The flat file has a measly 3000 rows is it, so its overall impact should really have no implications on our system right???? Let’s find out.  Please note that this problem can manifest itself by hitting a tipping point of data also… Meaning it does not take a huge influx of data to cause this problem, and this is why this problem can appear seemingly out of nowhere.

I will load the data with the same insert statement to mimic our data migration.

INSERT INTO dbo.TestData
SELECT TOP 3000 
    CASE WHEN ROW_NUMBER() OVER (ORDER BY t1.NAME) %5 = 0 THEN 1 ELSE 0 END AS SomeBit, 
    'A' AS SomeCode
FROM 
    Master.dbo.SysColumns t1,
    Master.dbo.SysColumns t2
GO

Now let’s run our same update transaction again.

UPDATE dbo.TestData
SET SomeCode = 'B'
WHERE somebit = 0

Now run the query below in a new window.

SELECT RowNum FROM dbo.TestData WHERE RowNum = 1000

What you should see is the query is now blocked.  Keep in mind that nothing changed on this server, except new data was inserted into the table.  Any ideas why this problem is now occurring?  If you haven’t figured it out yet, this problem is caused by lock escalation, http://msdn.microsoft.com/en-us/library/ms184286.aspx.  When SQL Server meets certain thresholds or memory pressure exists, SQL Server will escalate locks.  Lock escalation unfortunately goes from very granular locks to not so granular locks.  Lock escalation will go straight to a table lock from a rid/key or page lock.  What does this mean?  It means that SQL Server can save memory by acquiring a less granular lock, oppose to a lot of granular locks.  You can look at the transaction locks for each of the UPDATE statements to verify lock escalation is occurring.

Note: I removed intent locks as those locks from the resultset.

SELECT * 
FROM sys.[dm_tran_locks] 
WHERE [request_session_id] = xx
AND [request_mode] = 'X'
AND [request_mode] NOT LIKE 'I%'


Initial Update Query

image 

Lock Escalated Update Query

image

If you run a lot of big DML transactions in your environment and still require concurrency, you may want to pay careful attention to lock escalation; otherwise, you may experience an abnormally large number of blocks.  While lock escalation  is great in most cases, in others it is less than ideal.

Here are the thresholds as described by BOL, http://msdn.microsoft.com/en-us/library/ms184286.aspx

Lock Escalation Thresholds


Lock escalation is triggered when lock escalation is not disabled on the table by using the ALTER TABLE SET LOCK_ESCALATION option, and when either of the following conditions exists:

  • A single Transact-SQL statement acquires at least 5,000 locks on a single nonpartitioned table or index.

  • A single Transact-SQL statement acquires at least 5,000 locks on a single partition of a partitioned table and the ALTER TABLE SET LOCK_ESCALATION option is set to AUTO.

  • The number of locks in an instance of the Database Engine exceeds memory or configuration thresholds.

If locks cannot be escalated because of lock conflicts, the Database Engine periodically triggers lock escalation at every 1,250 new locks acquired.

Now that we have identified the problem, what can we do to fix it?  There are a number of options that can be used  to solve this problem.  One solution is to use the nolock hint in your query or the read uncommited isolation level.  This particular solution is not recommend for all OLTP environments and should only be implemented with careful consideration.  The nolock hint and the read uncommitted isolation level can return inconsistent data.  If and only if this is okay, should you consider this as a solution.  Another solution is to use the read committed snapshot isolation level or the snapshot isolation level.  Both of these solutions require tempdb overhead, but do return transactional consistent data.  You can read more about these isolation levels here, http://msdn.microsoft.com/en-us/library/ms189122.aspx.  The other approach is to remove lock escalation.  You can remove lock escalation at the instance level (trace flags 1211 and 1224) or at the table level in SQL Server 2008, using the ALTER TABLE statement.  Obviously, removing lock escalation should be carefully thought out and tested.  For more information on these trace flags, please visit the storage engine’s blog http://blogs.msdn.com/b/sqlserverstorageengine/archive/2006/05/17/lock-escalation.aspx.

There you have it. I have shown you how simply adding data to your table can literally make a fast application a blocking nightmare overnight.  Before you go off and start adding nolock hints or changing your isolation level, please understand that you should only take these steps if you are experiencing this problem.  The reality is an OLTP system should not be holding onto more than 5000 (a lock escalation tipping point) locks because transactions should be short and efficient.  If you are experiencing this problem, your database is probably OLAP, you are missing indexes, or you queries are not typical OLTP transactions.  For example, you probably have large DML transactions and users trying to query the table concurrently.  

Until next time happy coding.

Tuesday, May 4, 2010

Performance tuning Case Expressions With Correlated Subqueries

Today I wanted to talk about some potential pitfalls that a developer may encounter when using correlated subqueries, in a case expression.  As you may recall, I have done a post on the potential performance pitfalls, in using correlated subqueries, before  http://jahaines.blogspot.com/2009/06/correlated-sub-queries-for-good-or-evil.html.  In this post, I will be focusing on case expressions that use  correlated subqueries.

I will start by creating a sample table.

USE [tempdb]
GO

IF EXISTS(SELECT 1 FROM sys.tables WHERE NAME = 'TestData')
BEGIN
    DROP TABLE dbo.[TestData];
END
GO

CREATE TABLE dbo.TestData(
RowNum INT PRIMARY KEY ,
SomeChar TINYINT
);
GO

INSERT INTO dbo.TestData
SELECT TOP 1000 
    ROW_NUMBER() OVER (ORDER BY t1.NAME) AS RowNumber,
    ABS(CHECKSUM(NEWID())%3+1)
FROM 
    Master.dbo.SysColumns t1,
    Master.dbo.SysColumns t2
GO

CREATE NONCLUSTERED INDEX ncl_idx_SomeChar ON dbo.TestData(SomeChar);
GO

IF EXISTS(SELECT 1 FROM sys.tables WHERE NAME = 'TestData2')
BEGIN
    DROP TABLE dbo.[TestData2];
END
GO

CREATE TABLE dbo.TestData2(
Id INT IDENTITY(1,1) PRIMARY KEY,
RowNum INT unique,
SomeChar TINYINT
);
GO

INSERT INTO dbo.TestData2
SELECT TOP 500
    ROW_NUMBER() OVER (ORDER BY t1.NAME) AS RowNumber,
    ABS(CHECKSUM(NEWID())%3+1)
FROM 
    Master.dbo.SysColumns t1,
    Master.dbo.SysColumns t2
GO

CREATE NONCLUSTERED INDEX ncl_idx_SomeChar ON dbo.TestData2(SomeChar);
GO

A typical correlated subquery in a case expression may look something like this:

SELECT 
    RowNum,SomeChar,
    CASE (SELECT SomeChar FROM dbo.TestData2 t2 WHERE t2.RowNum = t1.RowNum) 
        WHEN 1 THEN 'Type1' 
        WHEN 2 THEN 'Type2'
        WHEN 3 THEN 'Type3'
    END
FROM dbo.TestData t1
WHERE [RowNum] <= 500

Let’s have a look at the execution plan to see what is going on underneath the hood

image

IO:

Table 'Worktable'. Scan count 442, logical reads 2886, physical reads 0, read-ahead reads 0, lob logical reads 0, lob physical reads 0, lob read-ahead reads 0.
Table 'TestData2'. Scan count 3, logical reads 12, physical reads 0, read-ahead reads 0, lob logical reads 0, lob physical reads 0, lob read-ahead reads 0.
Table 'TestData'. Scan count 1, logical reads 2, physical reads 0, read-ahead reads 0, lob logical reads 0, lob physical reads 0, lob read-ahead reads 0.

Whoa!!! This query is extremely inefficient.  As you can see the TestData2 table was scanned 3 times and a worker table was created and scanned 442 times.  The problem here is the optimizer chooses to spool the data from dbo.TestData2 twice.  The even bigger problem with this method is scalability.  This code does not scale well at all.  In the case of this query, the optimizer creates a relational number of index spools to the number of elements in the case expression.  The relationship can be defined as Number Of Spools = Number of Case Elements – 1.  What does this mean? It means that if your case expression has 4 elements you get 3 spools… if you case expression has 5 elements you get 4 spools and so on.  Simply put…..query performance decreases as the number of elements in the case expression increase.  Take a look at the example below.

image

IO:

Table 'Worktable'. Scan count 539, logical reads 4081, physical reads 0, read-ahead reads 0, lob logical reads 0, lob physical reads 0, lob read-ahead reads 0.
Table 'TestData2'. Scan count 4, logical reads 16, physical reads 0, read-ahead reads 0, lob logical reads 0, lob physical reads 0, lob read-ahead reads 0.
Table 'TestData'. Scan count 1, logical reads 2, physical reads 0, read-ahead reads 0, lob logical reads 0, lob physical reads 0, lob read-ahead reads 0.

So how should we change the query to help the optimizer make a better decision? 

The best solution is to allow the optimizer to get the computed value, while it is joining the TestData2 table, as shown below.

SELECT 
    RowNum,SomeChar,
    (SELECT CASE SomeChar WHEN 1 THEN 'Type1' WHEN 2 THEN 'Type2' WHEN 3 THEN 'Type3' END FROM dbo.TestData2 t2 WHERE t2.RowNum = t1.RowNum) 
FROM dbo.TestData t1
WHERE [RowNum] <= 500

image

IO:

Table 'Worktable'. Scan count 0, logical reads 0, physical reads 0, read-ahead reads 0, lob logical reads 0, lob physical reads 0, lob read-ahead reads 0.
Table 'TestData2'. Scan count 1, logical reads 4, physical reads 0, read-ahead reads 0, lob logical reads 0, lob physical reads 0, lob read-ahead reads 0.
Table 'TestData'. Scan count 1, logical reads 2, physical reads 0, read-ahead reads 0, lob logical reads 0, lob physical reads 0, lob read-ahead reads 0.

As you can see, this is a much better query plan.  The key here is the optimizer is able to use a compute scalar operator upstream, while joining the tables. Because the computed value is joined to the TestData table, we do not have to worry about spooling the data.

Conclusion

For me, correlated subqueries can have inconsistent behavior and often bear performance problems, such as this one.  Do not get me wrong, correlated subqueries are not all bad, but they should be thoroughly tested.  In my opinion, the best way to write this query is to LEFT OUTER JOIN dbo.TestData2.  An outer join will provide more consistent performance.

SELECT 
    t1.RowNum,t1.SomeChar,
    CASE t2.SomeChar 
        WHEN 1 THEN 'Type1' 
        WHEN 2 THEN 'Type2'
        WHEN 3 THEN 'Type3'
    END
FROM dbo.TestData t1
LEFT JOIN dbo.TestData2 t2  ON t1.RowNum = t2.RowNum
WHERE t1.[RowNum] <= 500

Until next time, happy coding.

Wednesday, March 17, 2010

Performance Tuning 101 – What You Will Not Learn In The Class Room (Part 2)

In my last post, http://jahaines.blogspot.com/2010/03/performance-tuning-101-what-you-will.html I talked about performance tuning queries that appear to be well tuned. There are a lot of optimization techniques available unbeknownst to most developers that do not require indexes or radical code changes. These are the optimizations that I will be talking about in this post. There is absolutely no way I could go over every possible optimization technique available, but I will do my best to present as much content here today, and will make future posts on other techniques.

I will start things off by talking about a challenge that Ramesh Meyyappan presented in his webcast, http://www.sqlworkshops.com/. Ramesh’s challenge was to solve the TOP 101 phenomenon, using SQL Server 2005. To start things off, I will create a sample table, with data.

USE [tempdb]
GO

SET NOCOUNT ON;
GO

IF EXISTS(SELECT 1 FROM sys.tables WHERE NAME = 'TestData')
BEGIN
    DROP TABLE dbo.[TestData];
END
GO

CREATE TABLE dbo.TestData(
RowNum INT PRIMARY KEY,
SomeId INT,
SomeCode CHAR(2000)
);
GO

;WITH
   L0 AS (SELECT 1 AS C UNION ALL SELECT 1)       --2 rows
  ,L1 AS (SELECT 1 AS C FROM L0 AS A, L0 AS B)    --4 rows (2x2)
  ,L2 AS (SELECT 1 AS C FROM L1 AS A, L1 AS B)    --16 rows (4x4)
  ,L3 AS (SELECT 1 AS C FROM L2 AS A, L2 AS B)    --256 rows (16x16)
  ,L4 AS (SELECT 1 AS C FROM L3 AS A, L3 AS B)    --65536 rows (256x256)
  ,L5 AS (SELECT 1 AS C FROM L4 AS A, L4 AS B)    --4,294,967,296 rows (65536x65536)
  ,Number AS (SELECT row_number() OVER (ORDER BY (SELECT 0)) AS N FROM L5)
INSERT INTO dbo.TestData
SELECT
    N AS RowNumber,
    ABS(CHECKSUM(NEWID()))%1000000+1 AS SomeId ,
    REPLICATE('a',2000) AS SomeCode
FROM Number
WHERE [N] <= 50000
GO

UPDATE STATISTICS dbo.[TestData] WITH FULLSCAN;
GO

Next, I will create a query that uses TOP and an order by to return 100 rows.

--Fast
SELECT TOP 100 [RowNum],[SomeId],[SomeCode]
FROM dbo.[TestData]
WHERE [RowNum] < 30000
ORDER BY [SomeId]
OPTION (MAXDOP 1)
/*
SQL Server parse and compile time:
   CPU time = 0 ms, elapsed time = 1 ms.

 SQL Server Execution Times:
   CPU time = 78 ms,  elapsed time = 102 ms.
SQL Server parse and compile time:
   CPU time = 0 ms, elapsed time = 0 ms.
*/

Now watch what happens when I change the TOP operator to 101. You will notice that I did not change anything else in the query other than increasing the number of rows returned by 1.

--Slow
SELECT TOP 101 [RowNum],[SomeId],[SomeCode]
FROM dbo.[TestData]
WHERE [RowNum] < 30000
ORDER BY [SomeId]
OPTION(MAXDOP 1)

/*
SQL Server parse and compile time:
   CPU time = 0 ms, elapsed time = 0 ms.

 SQL Server Execution Times:
   CPU time = 312 ms,  elapsed time = 1690 ms.
SQL Server parse and compile time:
   CPU time = 0 ms, elapsed time = 0 ms.
*/

Wow…. TOP 101 is over 17 times slower than TOP 100 and all I changed is the number of rows in the TOP operator!!!!! So why does the optimizer take so much longer to optimize and execute a query using TOP 101, oppose to TOP 100? The short answer is the memory requirements. The TOP 101 queries requires a lot more query memory than TOP 100, which translates into tempdb sorting. As you may recall, I addressed some techniques to solve the tempdb sorting problem in my last post, http://jahaines.blogspot.com/2010/03/performance-tuning-101-what-you-will.html. If you are using SQL 2008, you can use the same optimization techniques presented in my prior post, but SQL 2005 is a completely different animal. To make the TOP 101 query faster, we need to first understand why it is slower. Let’s take a look at what is different when we run the TOP 100 and the TOP 101 query.

Lets start by looking at the memory SQL Server grants to each query. Open two different query windows and execute each top query within a while loop. We can then use sys.dm_os_memory_grants to get the required memory.

Here is a sample of how to run the TOP query in a while loop.

WHILE 1=1
SELECT TOP 100 [RowNum],[SomeId],[SomeCode]
FROM dbo.[TestData]
WHERE [RowNum] < 30000
ORDER BY [SomeId]
OPTION(MAXDOP 1)

In a new query window, run the following query to get the memory specifications.

SELECT  [granted_memory_kb],[required_memory_kb],[max_used_memory_kb] FROM sys.dm_exec_query_memory_grants WHERE [session_id] = 58

Here are my results:

     granted_memory_kb    required_memory_kb   max_used_memory_kb
---- -------------------- -------------------- --------------------
FAST 1024                 216                  216

     granted_memory_kb    required_memory_kb   max_used_memory_kb
---- -------------------- -------------------- --------------------
SLOW 6040                 512                  6040

The results are simply astonishing. The memory requirements increase nearly 28 times when I use TOP 101, instead of TOP 100. I do not have a formal explanation of why the TOP 101 operator, consumes more memory than TOP 100. Brad Schulz, http://bradsruminations.blogspot.com/, has contacted Conor Cunningham about this issue and believes that 101 is an arbitrary threshold. Brad is working on an in-depth post involving the TOP operator. Keep an eye out for this one, as it should be really good. Anyway, once the 101 threshold is breached the optimizer uses different calculations to optimize a query, which can effectively bloat the memory requirements for the query. This memory bloat forces the sort operation to spill into tempdb. This is where the TOP 101 bottleneck exists. To verify this problem, open profiler and choose the sort warnings counter and you will see that the slow query has a sort warning error, while the fast query does not.

Now that I have identified the problem, how do I solve it? I will start by attempting the methods that I used in the previous article, http://jahaines.blogspot.com/2010/03/performance-tuning-101-what-you-will.html.

SELECT TOP 101 [RowNum],[SomeId],CAST([SomeCode] AS VARCHAR(4200))
FROM dbo.[TestData]
WHERE [RowNum] < 30000
ORDER BY [SomeId]
OPTION(MAXDOP 1)

/*
 SQL Server Execution Times:
   CPU time = 344 ms,  elapsed time = 3385 ms.
SQL Server parse and compile time:
   CPU time = 0 ms, elapsed time = 0 ms.
*/

Bloating the estimated row size still did not help our situation. Next I will try shrinking the row size.

SELECT TOP 101 [RowNum],[SomeId],RTRIM(CAST([SomeCode] AS VARCHAR(2000)))
FROM dbo.[TestData]
WHERE [RowNum] < 30000
ORDER BY [SomeId]
OPTION(MAXDOP 1)

/*
 SQL Server Execution Times:
   CPU time = 344 ms,  elapsed time = 2461 ms.
SQL Server parse and compile time:
   CPU time = 0 ms, elapsed time = 0 ms.
*/

Hmm. Still no luck….. How can I reduce the row size of the input passed into the sort operator? When you really sit back and think about the problem, the answer is really simple. To reduce the row size, all you have to do is reduce the columns involved in the sort. I like to use the TOP inside a derived table, making sure to only use the RowNum and SomeId columns. We can then join back onto the TestData table. This gives us a fast sort and a ultra fast index seek on the 101 rows we are returning.

SELECT t.[RowNum],t.[SomeId], t.[SomeCode]
FROM dbo.[TestData] t
INNER JOIN(
    SELECT TOP 101 [RowNum],[SomeId]
    FROM dbo.[TestData]
    WHERE [RowNum] < 30000
    ORDER BY [SomeId]
) AS t2
    ON T.RowNum = t2.RowNum
ORDER BY t.[SomeId]
OPTION (MAXDOP 1)

/*
 SQL Server Execution Times:
   CPU time = 31 ms,  elapsed time = 104 ms.
SQL Server parse and compile time:
   CPU time = 0 ms, elapsed time = 0 ms.
*/

Alternatively, we can use correlated subqueries or the cross apply operator.

SELECT TOP 101
    t.[RowNum],
    (SELECT t2.[SomeId] FROM dbo.[TestData] t2 WHERE t2.[RowNum] = t.[RowNum]) AS SomeId,
    (SELECT t2.[SomeCode] FROM dbo.[TestData] t2 WHERE t2.[RowNum] = t.[RowNum]) AS SomeCode
FROM dbo.[TestData] t
WHERE t.[RowNum] < 30000
ORDER BY t.[SomeId]
OPTION (MAXDOP 1)

SELECT TOP 101
    t.[RowNum],
    t2.SomeId,
    t2.SomeCode
FROM dbo.[TestData] T
CROSS APPLY(SELECT t2.SomeId, t2.SomeCode FROM dbo.[TestData] t2 WHERE t2.[RowNum] = t.[RowNum]) AS t2
WHERE t.[RowNum] < 30000
ORDER BY t.[SomeId]
OPTION (MAXDOP 1)

It should be noted that the correlated subquery method will produce more IO because it uses two subqueries. As you can see, the solution to this challenge is quite simple, but the solution requires an understanding of what is occurring underneath the hood of SQL Server.

Note: It is still possible that some of the sorting will be sent to tempdb, but you should see a elapsed time that rivals TOP 100.

The next optimization technique, I will be demonstrating is a predicate pushing problem. Unbeknownst to most developers, SQL Server 2005 does have a problem with predicate pushing in views. A lot of these issues have been resolved in SQL Server 2008, but should be known. I will be demonstrating a very simple example, using a ranking function. Ranking functions are relatively new to SQL Server and were introduced in 2005. I am sure there are other scenarios that cause predicate pushing problems, but I will only be addressing the ranking problem, in this post.

Let’s start by creating a small sample table.

USE [tempdb]
GO

CREATE TABLE Test(
ID INT IDENTITY(1,1) PRIMARY KEY,
FName VARCHAR(50),
LName VARCHAR(50)
);

INSERT INTO dbo.Test VALUES ('Adam','Haines');
INSERT INTO dbo.Test VALUES ('John','Smith');
INSERT INTO dbo.Test VALUES ('Jane','Doe');
GO

CREATE NONCLUSTERED INDEX ncl_idx_LName ON dbo.Test(LName) INCLUDE(FName);
GO

As you can see, the table is relatively simple. The idea is to present an easy to understand example that demonstrates potential performance problems with views.

Here is my simple query that shows an index seek on LName.

SELECT Id,FName,LName,ROW_NUMBER() OVER(PARTITION BY LName ORDER BY Id) AS seq
FROM dbo.Test
WHERE LName = 'Smith'
GO

image

Let’s see what happens when I put the logic into a view, with no predicate. The predicate will be called from outside the view and should be pushed down into the view, as views are materialized into the underlying objects at runtime.

CREATE VIEW dbo.vw_Test
AS
SELECT Id,FName,LName,ROW_NUMBER() OVER(PARTITION BY LName ORDER BY Id) AS seq
FROM dbo.Test
GO

I will now query the view using the same predicate as the original query.

SELECT Id,FName,LName,seq
FROM dbo.vw_Test
WHERE LName = 'Smith'
GO

image

The problem here is the optimizer decided to filter the results of the query AFTER the table “Test” has been scanned. One should expect the optimizer to seek on the LName column because the optimizer should push the predicate; however, SQL Server 2005 does not do a great job of this. SQL Server 2008 will appropriately push the predicate deep into the plan to get the index seek. How do we solve this problem? Unfortunately, there is not a whole lot you can do to make the plan work more efficiently. The best option in my opinion is to a INLINE TVF to parameterize the query.

CREATE FUNCTION dbo.fn_Test(@LName VARCHAR(50))
RETURNS TABLE
RETURN(
    SELECT Id,FName,LName,ROW_NUMBER() OVER(PARTITION BY LName ORDER BY Id) AS seq
    FROM dbo.Test
    WHERE LName = @LName
)
GO

Now execute a select against the TVF using the same predicate.

SELECT Id,FName,LName,seq
FROM dbo.fn_Test('Smith')

image

There you have it. I have demonstrated a few optimization techniques that I have used to solve performance problems. I have only scratched the surface here. There are many more optimization techniques available. Stay tuned for future posts, where I will explore even more optimization techniques including a shocking example demonstrating how an index rebuild can introduce fragmentation and how to avoid it.

Until next time, happy coding.

Sunday, March 7, 2010

Performance Tuning 101 – What You Will Not Learn In The Classroom

I was reading an article last week and saw a snippet of code that claimed to make fully optimized code, more efficient.  The article itself was not written by the original content creator.  With a little investigative work, I came across the website and author who first developed the presented performance tuning techniques.  The website that hosted the content is http://www.sqlworkshops.com/ and the original author is Ramesh Meyyappan, rmeyyappan@sqlworkshops.com.  Ramesh is SQL Server consultant and professional trainer, who has worked previously with Microsoft and has real world knowledge of performance tuning techniques.  On the SQLWorkshops website, Ramesh offers 3 free webcasts that demonstrate how to performance tune queries.  He focuses on query memory, parallelism, MAXDOP (MAX Degree of parallelism), and wait stats.  I recommend that all database professionals view these webcasts.  There is a lot of great content presented in these webcasts that you cannot find in a classroom.  In this post, I will take a few of the methods provided and explain them.  I will also  provide additional methods that were not covered in the webcast.  On a side note, if you have not figured out the challenge Ramesh presented, I will show you a few of the solutions I came up with, in my next installment. 

The first optimization technique I will explore deals with data type mismanagement.  The two data types I will be evaluating in this post are VARCHAR and CHAR.  There are a lot of do’s and don’ts regarding these two data types, on the Internet.  I will not engage the pros and cons in this post.  The main point is a performance penalty can occur, if the wrong data type is chosen.  You should always choose a data type that most closely resembles the size and structure of your data.  Experienced database professionals know to use data types that closely resemble the data  being stored; however, inexperienced database professionals fail to see the long term impact of poor design choices.  Unfortunately, it is quite common for database professionals to use a catch all data type like VARCHAR(8000) or CHAR(2000), without fully understanding the data itself.  In most cases, choosing the wrong data type results in wasted storage and slower query performance, as I will show in this post.  I will get this party started by creating my sample table and data.

USE [tempdb]
GO

SET NOCOUNT ON
GO

IF EXISTS(SELECT 1 FROM sys.tables WHERE NAME = 'TestData')
BEGIN
    DROP TABLE dbo.[TestData];
END
GO

CREATE TABLE dbo.TestData(
RowNum INT PRIMARY KEY,
SomeId INT,
SomeCode CHAR(2000)
);
GO

;WITH 
   L0 AS (SELECT 1 AS C UNION ALL SELECT 1)       --2 rows
  ,L1 AS (SELECT 1 AS C FROM L0 AS A, L0 AS B)    --4 rows (2x2)
  ,L2 AS (SELECT 1 AS C FROM L1 AS A, L1 AS B)    --16 rows (4x4)
  ,L3 AS (SELECT 1 AS C FROM L2 AS A, L2 AS B)    --256 rows (16x16)
  ,L4 AS (SELECT 1 AS C FROM L3 AS A, L3 AS B)    --65536 rows (256x256)
  ,L5 AS (SELECT 1 AS C FROM L4 AS A, L4 AS B)    --4,294,967,296 rows (65536x65536)
  ,Number AS (SELECT row_number() OVER (ORDER BY (SELECT 0)) AS N FROM L5) 
INSERT INTO dbo.TestData
SELECT
    N AS RowNumber,
    ABS(CHECKSUM(NEWID()))%1000000+1 AS SomeId ,
    REPLICATE('a',ABS(CHECKSUM(NEWID())) % 2000 + 1) AS SomeCode
FROM Number
WHERE [N] <= 50000
GO

UPDATE STATISTICS dbo.[TestData] WITH FULLSCAN;
GO

The first thing I want to illustrate is the average size of our SomeCode column.  We are using a CHAR(2000) data type; however, we are storing much less data than this on average. 

SELECT AVG(LEN(SomeCode)) AS AvgLen FROM dbo.TestData WHERE [RowNum] < 35000 
/*
AvgLen
-----------
997
*/

As you can see from the query above the average SomeCode length is 997 bytes; however, we are storing 2000 bytes per row.    This means we are consuming 50% more storage, per row.  Using a char data type is typically faster than using a VARCHAR data type; however, the cost of storing CHAR data types usually offset the performance gain.  If I were to choose a VARCHAR(2000) data type, I would consume less storage, which translates into faster table scans, smaller tables, faster backups, faster restores etc….  Performance will increase because less storage, is directly correlated to less pages.   The bottom line is less is faster.

The query I will be demonstrating returns a range of rows, where the sort order is different than the primary clustered key sort.  The IO stats will be the same across all variants of this query, so the counter will not illustrate a proper delta.  I will be using elapsed time to illustrate the delta between queries, with varying predicates. 

Let’s turn on STATISTICS TIME and NOCOUNT.

SET NOCOUNT ON;
GO
SET STATISTICS TIME ON;
GO

Now run the following query.  Make sure to make query results go to text. (Note: I assign columns to local variables to avoid results being printed).  Run the query a couple of times to warm the cache and get a baseline CPU and elapsed time.

DECLARE @RowNum INT,@SomeInt INT, @SomeCode CHAR(2000)
SELECT @RowNum = [RowNum], @SomeInt = [SomeId], @SomeCode = [SomeCode]
FROM dbo.[TestData]
WHERE [RowNum] < 3000 --3000 is in memory and 3500 sort in tempdb
ORDER BY SomeId

image

The query is very fast and performs within our SLA of 2 seconds.  Let’s see what happens when I increase the number of rows in the predicate to 3500.

DECLARE @RowNum INT,@SomeInt INT, @SomeCode CHAR(2000)
SELECT @RowNum = [RowNum], @SomeInt = [SomeId], @SomeCode = [SomeCode]
FROM dbo.[TestData]
WHERE [RowNum] < 3500 --3000 is in memory and 3500 sort in tempdb
ORDER BY SomeId

image

Wow… by returning 5000 more rows, the query is over 14 times slower!  You may be thinking that the speed difference is neglible, but on production systems the elapsed time delta can be quite extensive, at which point performance is a real problem.  Let’s check the execution plan for each query side by side.

image

Well that is not much help….. both of our query plans look good.    There is really not much you can do to make the query perform better.  The index is doing a great job at returning the data., but that pesky sort is degrading performance.  The first thing I need to investigate is the detail of the query plan.The first query plan attribute I will look at is the clustered index seek estimated row size.  The estimated row size is derived from statistics and some internal calculations.   
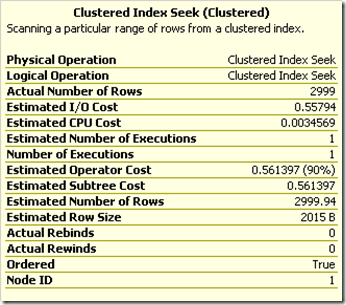
image

The row size is estimated to be 2015 bytes for each row in the clustered index seek.  The row size is derived from native data types.  For example, we are using a CHAR(2000) and two integer columns.  This makes our row size 2000 (1 byte per char)+ 4 (int) + 4 (int) = 2008.  As you can see, 2008 is less than 2015.  The additional 7 bytes are associated to row overhead and the NULL bitmap.  The sort operator is also estimated a row size of 2015.  All of the estimates play a part in dictating how much memory will be granted to the query.  Next I am going to put the query into a while loop, so I can see the memory grants.  Open two new query windows and paste the below code.  Make sure to change the RowNum to 3000, in one of the query windows.  Take note of the session id of each of the windows.

WHILE 1 = 1
BEGIN
DECLARE @RowNum INT,@SomeInt INT, @SomeCode CHAR(2000)
SELECT @RowNum = [RowNum], @SomeInt = [SomeId], @SomeCode = [SomeCode]
FROM dbo.[TestData]
WHERE [RowNum] < 3500 --SWITCH OUT TO 3500 TO 3000
ORDER BY SomeId
END

In a completely new window, paste the below DMV query.  This query will return the memory grants for each of the sessions.  The key columns from this query are Max_Used_Memory and Granted_Memory.  If the Max and Granted memory are the same, it is likely that the query is consuming all the RAM granted to the query and the optimizer has to rely on tempdb to help with some operations.

SELECT [granted_memory_kb],[required_memory_kb],[max_used_memory_kb] FROM sys.dm_exec_query_memory_grants WHERE [session_id] = 56
SELECT [granted_memory_kb],[required_memory_kb],[max_used_memory_kb] FROM sys.dm_exec_query_memory_grants WHERE [session_id] = 60

All the execution plan details look fine, so I will dig a bit deeper into tempdb to unearth the real problem.  Let’s have a look at the tempdb IO stats to see if either query is using tempdb to perform any operations.

I will start by executing the “fast” query.

SELECT * FROM sys.[dm_io_virtual_file_stats](2,1)

--FAST
DECLARE @RowNum INT,@SomeInt INT, @SomeCode CHAR(2000)
SELECT @RowNum = [RowNum], @SomeInt = [SomeId], @SomeCode = [SomeCode]
FROM dbo.[TestData]
WHERE [RowNum] < 3000 --3000 is in memory and 3500 sort in tempdb
ORDER BY SomeId

SELECT * FROM sys.[dm_io_virtual_file_stats](2,1)
GO
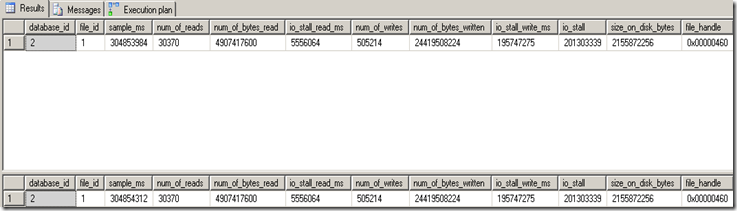
image

The important columns to look at are num_of_reads, num_of_bytes_read, num_of_writes, num_of_bytes_written.  The number of reads and writes before and after the query are exactly the same.  This means the optimizer did not have to use tempdb operations.  Next, I will execute the slow query, which uses a predicate of less than 3500.

SELECT * FROM sys.[dm_io_virtual_file_stats](2,1)

--FAST
DECLARE @RowNum INT,@SomeInt INT, @SomeCode CHAR(2000)
SELECT @RowNum = [RowNum], @SomeInt = [SomeId], @SomeCode = [SomeCode]
FROM dbo.[TestData]
WHERE [RowNum] < 3500 --3000 is in memory and 3500 sort in tempdb
ORDER BY SomeId

SELECT * FROM sys.[dm_io_virtual_file_stats](2,1)
GO
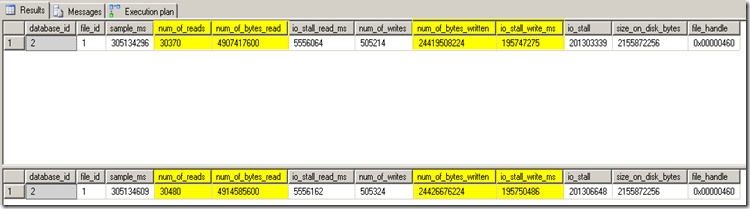
image

By George…… I think we have something!!!  Why does the second query have more reads and writes into tempdb?  The answer is the sort operation is being done in memory for the “fast” query and the sort is being done in tempdb for the “slow” query.  Another method you can use to identify tempdb sort operations is Sort Warninigs.  When tempdb is used to perform sort operations the sort warnings counter will display it.  Below is a screenshot of the counter and the description.

image

Now that I have identified the problem, how do I solve it?  There are a couple of ways to solve this problem.  One solutions is to increase the estimated row size, so the optimizer grants more memory to the query, which in turn allows the sort to fit into memory.  The second option is to decrease the row size, so the sort fits into memory.   Let’s see this in action.

DECLARE @RowNum INT,@SomeInt INT, @SomeCode VARCHAR(2000)
SELECT @RowNum = [RowNum], @SomeInt = [SomeId], @SomeCode = CAST([SomeCode] AS VARCHAR(2000))
FROM dbo.[TestData]
WHERE [RowNum] < 3500 --3000 is in memory and 3500 sort in tempdb
ORDER BY SomeId

This method uses cast to convert the CHAR(2000) column to a VARCHAR(2000).  Casting the column to a VARCHAR(2000)   helps to reduce the estimated row size.  The estimated row size of a VARCHAR column is calculated as 50% of the total size.  The estimated row size is 50% of the VARCHAR column because 50% is a safe estimate because it really does not know how full the row is.  Generally speaking, VARCHAR columns never use 100% of a variable column anyway, so this helps SQL Server save resources. In our case, a VARCHAR(2000) is estimated to be approximately 1000 bytes.  Let’s have a look at the execution plan.

image

Unfortunately the conversion itself is not enough to optimize this query.  Let’s try to trim the CHAR column prior to the cast, so the row size is decreased.  The interesting thing here is the optimizer still reports the same estimated row size; however, the sort now occurs in memory.  This will help the sort fit into memory because the estimated row size is significantly less than 1019 for each row, so the optimizer is unintentionally giving extra memory to process this query.   Let’s see this in action.

DECLARE @RowNum INT,@SomeInt INT, @SomeCode VARCHAR(2000)
SELECT @RowNum = [RowNum], @SomeInt = [SomeId], @SomeCode = RTRIM(CAST([SomeCode] AS VARCHAR(2000)))
FROM dbo.[TestData]
WHERE [RowNum] < 3500 --3000 is in memory and 3500 sort in tempdb
ORDER BY SomeId
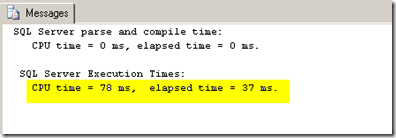
image

That’s  more like it.  If you run the query, with sys.dm_io_virtual_stats, you will see the query no longer uses tempdb to sort the rows.  This method works works well for queries where the predicate is < 3500.  If the returned range is significantly larger than 3500 rows, it is likely that the sort would spill into tempdb.  The idea here is to cater to every day usage patterns and let the exceptions take longer.  It should also be noted that if the CHAR(2000) column is nearly full for every row, the RTRIM method will not have the same impact.  When the RTRIM method is not cutting the mustard, it is time to go with another option…. such as bloating the estimated row size.

This is the solution presented in Ramesh’s webcast.  To do this we will use the same cast conversion, to introduce a compute scalar into the query plan, but this time we will make the value larger.  When choosing a larger number it is important to use a number that is not too large, as this could have an adverse effect on query performance, or other queries running on the server.  More information can be obtained via the webcast.

DECLARE @RowNum INT,@SomeInt INT, @SomeCode VARCHAR(4200)
SELECT @RowNum = [RowNum], @SomeInt = [SomeId], @SomeCode = CAST([SomeCode] AS VARCHAR(4200))
FROM dbo.[TestData]
WHERE [RowNum] < 3500 --3000 is in memory and 3500 sort in tempdb
ORDER BY SomeId
image 

Note: I am using SQL Server 2008 to perform my tests, but I have  tested both of these solutions in SQL Server 2005 and obtained similar results.

There you have it. I have done an introduction to performance tuning queries that seemingly have an ideal execution plan.  A lot of the concepts presented here were taken from http://sqlworkshops.com .  SQLWorkshops.com provides 3 webcasts that present a wealth of performance tuning tips that will benefit all levels of database professionals.  Stay tuned for my next post!!! I will be dissecting more query optimization techniques including two solutions to the TOP 101 challenge.

Until next time, happy coding.