Wednesday, March 24, 2010

SQL Server Management Studio Tips And Tricks

This week I decided I wanted to take a step back from my performance tuning series and present material that DBAs and developers may not know.  I will be focusing on SQL Server Management Studio (SSMS) tips and tricks. 

Keyboard Shortcuts:

SQL Server Management Studio allows keyboard shortcuts that can help you save time and increase efficiency.  Keyboard shortcuts allow you to execute TSQL commands at the push of a button. The best part about keyboard shortcuts is the shortcut can be used to pass highlighted text as parameters.  I will start with some of the built-in keyboard shortcuts.

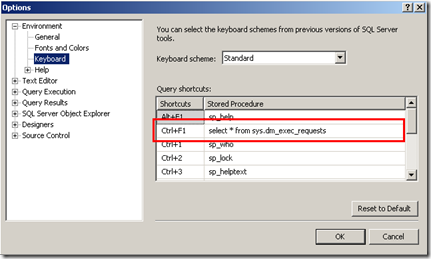
To open the keyboard shortcuts menu, click Tools –> Options –> Expand Environment –> Click Keyboard.  Now you will note that keyboard shortcuts are loaded by default.  Some of the defaults are sp_help (Alt+F1), sp_who (Ctrl+2) etc… You can implement just about any code you want in the keyboard shortcut.  For example, you can put the query “select * from sys.dm_exec_requests” directly into the text box.  The beauty of this is you can open a new query window and just hit the shortcut keys to execute the query.  This saves time and makes life a bit easier.  Below is a screenshot of my shortcut list, including the query I posted above.

image

Well that is all good and nice but what else can shortcuts do.  The best part about shortcuts in my opinion is they can actually be used to execute stored procedures and supply highlighted values as parameters.

Lets run sp_help but we will never type the text sp_help.  Open a new query window and create a new table.

CREATE TABLE dbo.MyTable(ID INT);

Now type MyTable in the query window and highlight the text.  Once the text is highlighted, hold Alt and press F1.  You should see the results of sp_help displayed for the highlighted object, “MyTable.”

image

Note: If you need to specify an object in a different schema, you have to use the two part name “schema.Object” and put it in single quotes.  For example, ‘dbo.MyTable’.

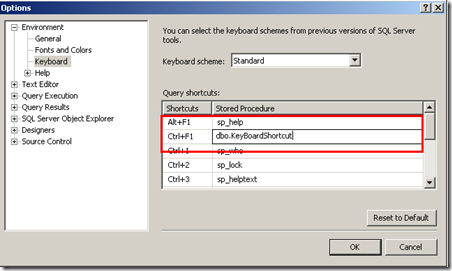
Now that is pretty cool right?  What I will show you next is even cooler!  I will execute a user defined stored procedure with parameters  Open the keyboard shortcut menu and assign the below stored procedure to a shortcut key. 

image

Open a new query window and create the below stored procedure.

CREATE PROCEDURE dbo.KeyBoardShortcut(@Id INT,@Col CHAR(1))
AS
BEGIN
    SELECT @Id,@Col
END
GO

Now type the text below and highlight it.  Once highlighted, hit Ctrl+F1. (Note: If you assigned the procedure to a different shortcut, you will need to use that shortcut)

1,'a'

image

As you can see, the stored procedure was executed with our highlighted parameters!  This is a awesome feature that can save a lot of time, especially when you have custom code that you need to access frequently.  This increases efficiency and puts more information at your fingertips.  One of my favorite shortcut keys is sp_helptext.  You can use create a shortcut for sp_helptext and highlight any procedure, function, view, trigger, or stored procedure and get the create script of that object.

Listing All Table Columns

This is a request that I see very often.  The request usually revolves around developers who have a lot of columns in their table and have to select from most of them.  As you can imagine, typing each column name can be a very tedious process. There are two methods that I use to accomplish this task, when I am feeling a little lazy…… BUT the key is to work smarter not harder right :^) !

The first method is to right-click the table click script table as –> SELECT To –> New Query Window.  Voila we now have a select query that lists all the columns in the table.  You can perform the same steps to get a list of all columns in a view.

The next method is to expand the table –> Drag the columns folder into the query window.  This will generate a column delimited list of the column names.

Scripting Multiple Objects

I am sure many of you have tried to script multiple objects from Management Studio, but have had little luck.  Now, we could choose to right-click the database –> tasks –> generate scripts, but where is the fun it that?  This is an easier way that does not make you jump through hoops or follow a wizard.  The trick is to click on the folder containing the objects you want to script and then look at the Object Explorer Details pane.  Inside the Object Explorer Details pane you can Ctrl or Shift click multiple objects.  Once selected, you can right-click –> Script <Object Type> AS –> Create –> To New Window.

image

Creating a TSQL Toolkit

One of the most underrated or unknown features of SQL Server Management Studio is Template Explorer.  You may be thinking that template explorer is used specifically for TSQL templates, but I will show you a couple of ways to make Template Explorer function as a TSQL Toolkit.  Click CTRL+ALT+T or go to view –> Template Explorer to open the window.

image

Now this does not look that impressive from the get, but trust me it can and does get better. Right-click SQL Server Templates and choose New –> then click folder.  Give the folder a name. I will be using the name Test_Scripts.  Next create a new template in the Test_Scripts folder.  I named the new template sys.dm_exec_requests.  Your template explorer should now look like this.

image

Okay, well that is great…… How does this help me?  Well lets add some TSQL code to that new template.  Once we add code to the template, We can then drag the template into any query window and SSMS will automatically post the code into the open query window.  Basically, we can use Template Explorer as our personal Toolkit.  We can create any folder structure we want and SSMS does a great job of keeping all our scripts organized.  Let’s see this in action.

Right-click the sys.dm_exec_requests template and choose edit.  Paste the code below and click save.

SELECT * FROM sys.dm_exec_requests

Open a new query window and drag the sys.dm_exec_requests  template into the query window. Voila!!!!!!! the TSQL is automatically scripted into our new query window.  As you can see, we can use the template explorer to save our scripts and make them easily accessible.  This alleviates our need to open windows explorer or browse the file system for our scripts.  Plus al the scripts are saved and managed in one place.  If you need to copy your scripts out of template explorer, the actually already exist on the file system.  The directory will be within your documents.  On my SQL Server 2008 instance, my templates are stored here, C:\Documents and Settings\ahaines\Application Data\Microsoft\Microsoft SQL Server\100\Tools\Shell\Templates\Sql.  I don’t know about you, but I for one love this feature.  This gives me the ability to quickly get data, without having to leave SSMS, plus I do not have to waste time searching the file system.  Give it a try and see what you think.

That is all the tips I have for now.  I hope that you have learned something new or any of these tips can help you.  Until next time, happy coding.
Wednesday, March 17, 2010

Performance Tuning 101 – What You Will Not Learn In The Class Room (Part 2)

In my last post, http://jahaines.blogspot.com/2010/03/performance-tuning-101-what-you-will.html I talked about performance tuning queries that appear to be well tuned. There are a lot of optimization techniques available unbeknownst to most developers that do not require indexes or radical code changes. These are the optimizations that I will be talking about in this post. There is absolutely no way I could go over every possible optimization technique available, but I will do my best to present as much content here today, and will make future posts on other techniques.

I will start things off by talking about a challenge that Ramesh Meyyappan presented in his webcast, http://www.sqlworkshops.com/. Ramesh’s challenge was to solve the TOP 101 phenomenon, using SQL Server 2005. To start things off, I will create a sample table, with data.

USE [tempdb]
GO

SET NOCOUNT ON;
GO

IF EXISTS(SELECT 1 FROM sys.tables WHERE NAME = 'TestData')
BEGIN
    DROP TABLE dbo.[TestData];
END
GO

CREATE TABLE dbo.TestData(
RowNum INT PRIMARY KEY,
SomeId INT,
SomeCode CHAR(2000)
);
GO

;WITH
   L0 AS (SELECT 1 AS C UNION ALL SELECT 1)       --2 rows
  ,L1 AS (SELECT 1 AS C FROM L0 AS A, L0 AS B)    --4 rows (2x2)
  ,L2 AS (SELECT 1 AS C FROM L1 AS A, L1 AS B)    --16 rows (4x4)
  ,L3 AS (SELECT 1 AS C FROM L2 AS A, L2 AS B)    --256 rows (16x16)
  ,L4 AS (SELECT 1 AS C FROM L3 AS A, L3 AS B)    --65536 rows (256x256)
  ,L5 AS (SELECT 1 AS C FROM L4 AS A, L4 AS B)    --4,294,967,296 rows (65536x65536)
  ,Number AS (SELECT row_number() OVER (ORDER BY (SELECT 0)) AS N FROM L5)
INSERT INTO dbo.TestData
SELECT
    N AS RowNumber,
    ABS(CHECKSUM(NEWID()))%1000000+1 AS SomeId ,
    REPLICATE('a',2000) AS SomeCode
FROM Number
WHERE [N] <= 50000
GO

UPDATE STATISTICS dbo.[TestData] WITH FULLSCAN;
GO

Next, I will create a query that uses TOP and an order by to return 100 rows.

--Fast
SELECT TOP 100 [RowNum],[SomeId],[SomeCode]
FROM dbo.[TestData]
WHERE [RowNum] < 30000
ORDER BY [SomeId]
OPTION (MAXDOP 1)
/*
SQL Server parse and compile time:
   CPU time = 0 ms, elapsed time = 1 ms.

 SQL Server Execution Times:
   CPU time = 78 ms,  elapsed time = 102 ms.
SQL Server parse and compile time:
   CPU time = 0 ms, elapsed time = 0 ms.
*/

Now watch what happens when I change the TOP operator to 101. You will notice that I did not change anything else in the query other than increasing the number of rows returned by 1.

--Slow
SELECT TOP 101 [RowNum],[SomeId],[SomeCode]
FROM dbo.[TestData]
WHERE [RowNum] < 30000
ORDER BY [SomeId]
OPTION(MAXDOP 1)

/*
SQL Server parse and compile time:
   CPU time = 0 ms, elapsed time = 0 ms.

 SQL Server Execution Times:
   CPU time = 312 ms,  elapsed time = 1690 ms.
SQL Server parse and compile time:
   CPU time = 0 ms, elapsed time = 0 ms.
*/

Wow…. TOP 101 is over 17 times slower than TOP 100 and all I changed is the number of rows in the TOP operator!!!!! So why does the optimizer take so much longer to optimize and execute a query using TOP 101, oppose to TOP 100? The short answer is the memory requirements. The TOP 101 queries requires a lot more query memory than TOP 100, which translates into tempdb sorting. As you may recall, I addressed some techniques to solve the tempdb sorting problem in my last post, http://jahaines.blogspot.com/2010/03/performance-tuning-101-what-you-will.html. If you are using SQL 2008, you can use the same optimization techniques presented in my prior post, but SQL 2005 is a completely different animal. To make the TOP 101 query faster, we need to first understand why it is slower. Let’s take a look at what is different when we run the TOP 100 and the TOP 101 query.

Lets start by looking at the memory SQL Server grants to each query. Open two different query windows and execute each top query within a while loop. We can then use sys.dm_os_memory_grants to get the required memory.

Here is a sample of how to run the TOP query in a while loop.

WHILE 1=1
SELECT TOP 100 [RowNum],[SomeId],[SomeCode]
FROM dbo.[TestData]
WHERE [RowNum] < 30000
ORDER BY [SomeId]
OPTION(MAXDOP 1)

In a new query window, run the following query to get the memory specifications.

SELECT  [granted_memory_kb],[required_memory_kb],[max_used_memory_kb] FROM sys.dm_exec_query_memory_grants WHERE [session_id] = 58

Here are my results:

     granted_memory_kb    required_memory_kb   max_used_memory_kb
---- -------------------- -------------------- --------------------
FAST 1024                 216                  216

     granted_memory_kb    required_memory_kb   max_used_memory_kb
---- -------------------- -------------------- --------------------
SLOW 6040                 512                  6040

The results are simply astonishing. The memory requirements increase nearly 28 times when I use TOP 101, instead of TOP 100. I do not have a formal explanation of why the TOP 101 operator, consumes more memory than TOP 100. Brad Schulz, http://bradsruminations.blogspot.com/, has contacted Conor Cunningham about this issue and believes that 101 is an arbitrary threshold. Brad is working on an in-depth post involving the TOP operator. Keep an eye out for this one, as it should be really good. Anyway, once the 101 threshold is breached the optimizer uses different calculations to optimize a query, which can effectively bloat the memory requirements for the query. This memory bloat forces the sort operation to spill into tempdb. This is where the TOP 101 bottleneck exists. To verify this problem, open profiler and choose the sort warnings counter and you will see that the slow query has a sort warning error, while the fast query does not.

Now that I have identified the problem, how do I solve it? I will start by attempting the methods that I used in the previous article, http://jahaines.blogspot.com/2010/03/performance-tuning-101-what-you-will.html.

SELECT TOP 101 [RowNum],[SomeId],CAST([SomeCode] AS VARCHAR(4200))
FROM dbo.[TestData]
WHERE [RowNum] < 30000
ORDER BY [SomeId]
OPTION(MAXDOP 1)

/*
 SQL Server Execution Times:
   CPU time = 344 ms,  elapsed time = 3385 ms.
SQL Server parse and compile time:
   CPU time = 0 ms, elapsed time = 0 ms.
*/

Bloating the estimated row size still did not help our situation. Next I will try shrinking the row size.

SELECT TOP 101 [RowNum],[SomeId],RTRIM(CAST([SomeCode] AS VARCHAR(2000)))
FROM dbo.[TestData]
WHERE [RowNum] < 30000
ORDER BY [SomeId]
OPTION(MAXDOP 1)

/*
 SQL Server Execution Times:
   CPU time = 344 ms,  elapsed time = 2461 ms.
SQL Server parse and compile time:
   CPU time = 0 ms, elapsed time = 0 ms.
*/

Hmm. Still no luck….. How can I reduce the row size of the input passed into the sort operator? When you really sit back and think about the problem, the answer is really simple. To reduce the row size, all you have to do is reduce the columns involved in the sort. I like to use the TOP inside a derived table, making sure to only use the RowNum and SomeId columns. We can then join back onto the TestData table. This gives us a fast sort and a ultra fast index seek on the 101 rows we are returning.

SELECT t.[RowNum],t.[SomeId], t.[SomeCode]
FROM dbo.[TestData] t
INNER JOIN(
    SELECT TOP 101 [RowNum],[SomeId]
    FROM dbo.[TestData]
    WHERE [RowNum] < 30000
    ORDER BY [SomeId]
) AS t2
    ON T.RowNum = t2.RowNum
ORDER BY t.[SomeId]
OPTION (MAXDOP 1)

/*
 SQL Server Execution Times:
   CPU time = 31 ms,  elapsed time = 104 ms.
SQL Server parse and compile time:
   CPU time = 0 ms, elapsed time = 0 ms.
*/

Alternatively, we can use correlated subqueries or the cross apply operator.

SELECT TOP 101
    t.[RowNum],
    (SELECT t2.[SomeId] FROM dbo.[TestData] t2 WHERE t2.[RowNum] = t.[RowNum]) AS SomeId,
    (SELECT t2.[SomeCode] FROM dbo.[TestData] t2 WHERE t2.[RowNum] = t.[RowNum]) AS SomeCode
FROM dbo.[TestData] t
WHERE t.[RowNum] < 30000
ORDER BY t.[SomeId]
OPTION (MAXDOP 1)

SELECT TOP 101
    t.[RowNum],
    t2.SomeId,
    t2.SomeCode
FROM dbo.[TestData] T
CROSS APPLY(SELECT t2.SomeId, t2.SomeCode FROM dbo.[TestData] t2 WHERE t2.[RowNum] = t.[RowNum]) AS t2
WHERE t.[RowNum] < 30000
ORDER BY t.[SomeId]
OPTION (MAXDOP 1)

It should be noted that the correlated subquery method will produce more IO because it uses two subqueries. As you can see, the solution to this challenge is quite simple, but the solution requires an understanding of what is occurring underneath the hood of SQL Server.

Note: It is still possible that some of the sorting will be sent to tempdb, but you should see a elapsed time that rivals TOP 100.

The next optimization technique, I will be demonstrating is a predicate pushing problem. Unbeknownst to most developers, SQL Server 2005 does have a problem with predicate pushing in views. A lot of these issues have been resolved in SQL Server 2008, but should be known. I will be demonstrating a very simple example, using a ranking function. Ranking functions are relatively new to SQL Server and were introduced in 2005. I am sure there are other scenarios that cause predicate pushing problems, but I will only be addressing the ranking problem, in this post.

Let’s start by creating a small sample table.

USE [tempdb]
GO

CREATE TABLE Test(
ID INT IDENTITY(1,1) PRIMARY KEY,
FName VARCHAR(50),
LName VARCHAR(50)
);

INSERT INTO dbo.Test VALUES ('Adam','Haines');
INSERT INTO dbo.Test VALUES ('John','Smith');
INSERT INTO dbo.Test VALUES ('Jane','Doe');
GO

CREATE NONCLUSTERED INDEX ncl_idx_LName ON dbo.Test(LName) INCLUDE(FName);
GO

As you can see, the table is relatively simple. The idea is to present an easy to understand example that demonstrates potential performance problems with views.

Here is my simple query that shows an index seek on LName.

SELECT Id,FName,LName,ROW_NUMBER() OVER(PARTITION BY LName ORDER BY Id) AS seq
FROM dbo.Test
WHERE LName = 'Smith'
GO

image

Let’s see what happens when I put the logic into a view, with no predicate. The predicate will be called from outside the view and should be pushed down into the view, as views are materialized into the underlying objects at runtime.

CREATE VIEW dbo.vw_Test
AS
SELECT Id,FName,LName,ROW_NUMBER() OVER(PARTITION BY LName ORDER BY Id) AS seq
FROM dbo.Test
GO

I will now query the view using the same predicate as the original query.

SELECT Id,FName,LName,seq
FROM dbo.vw_Test
WHERE LName = 'Smith'
GO

image

The problem here is the optimizer decided to filter the results of the query AFTER the table “Test” has been scanned. One should expect the optimizer to seek on the LName column because the optimizer should push the predicate; however, SQL Server 2005 does not do a great job of this. SQL Server 2008 will appropriately push the predicate deep into the plan to get the index seek. How do we solve this problem? Unfortunately, there is not a whole lot you can do to make the plan work more efficiently. The best option in my opinion is to a INLINE TVF to parameterize the query.

CREATE FUNCTION dbo.fn_Test(@LName VARCHAR(50))
RETURNS TABLE
RETURN(
    SELECT Id,FName,LName,ROW_NUMBER() OVER(PARTITION BY LName ORDER BY Id) AS seq
    FROM dbo.Test
    WHERE LName = @LName
)
GO

Now execute a select against the TVF using the same predicate.

SELECT Id,FName,LName,seq
FROM dbo.fn_Test('Smith')

image

There you have it. I have demonstrated a few optimization techniques that I have used to solve performance problems. I have only scratched the surface here. There are many more optimization techniques available. Stay tuned for future posts, where I will explore even more optimization techniques including a shocking example demonstrating how an index rebuild can introduce fragmentation and how to avoid it.

Until next time, happy coding.

Sunday, March 7, 2010

Performance Tuning 101 – What You Will Not Learn In The Classroom

I was reading an article last week and saw a snippet of code that claimed to make fully optimized code, more efficient.  The article itself was not written by the original content creator.  With a little investigative work, I came across the website and author who first developed the presented performance tuning techniques.  The website that hosted the content is http://www.sqlworkshops.com/ and the original author is Ramesh Meyyappan, rmeyyappan@sqlworkshops.com.  Ramesh is SQL Server consultant and professional trainer, who has worked previously with Microsoft and has real world knowledge of performance tuning techniques.  On the SQLWorkshops website, Ramesh offers 3 free webcasts that demonstrate how to performance tune queries.  He focuses on query memory, parallelism, MAXDOP (MAX Degree of parallelism), and wait stats.  I recommend that all database professionals view these webcasts.  There is a lot of great content presented in these webcasts that you cannot find in a classroom.  In this post, I will take a few of the methods provided and explain them.  I will also  provide additional methods that were not covered in the webcast.  On a side note, if you have not figured out the challenge Ramesh presented, I will show you a few of the solutions I came up with, in my next installment. 

The first optimization technique I will explore deals with data type mismanagement.  The two data types I will be evaluating in this post are VARCHAR and CHAR.  There are a lot of do’s and don’ts regarding these two data types, on the Internet.  I will not engage the pros and cons in this post.  The main point is a performance penalty can occur, if the wrong data type is chosen.  You should always choose a data type that most closely resembles the size and structure of your data.  Experienced database professionals know to use data types that closely resemble the data  being stored; however, inexperienced database professionals fail to see the long term impact of poor design choices.  Unfortunately, it is quite common for database professionals to use a catch all data type like VARCHAR(8000) or CHAR(2000), without fully understanding the data itself.  In most cases, choosing the wrong data type results in wasted storage and slower query performance, as I will show in this post.  I will get this party started by creating my sample table and data.

USE [tempdb]
GO

SET NOCOUNT ON
GO

IF EXISTS(SELECT 1 FROM sys.tables WHERE NAME = 'TestData')
BEGIN
    DROP TABLE dbo.[TestData];
END
GO

CREATE TABLE dbo.TestData(
RowNum INT PRIMARY KEY,
SomeId INT,
SomeCode CHAR(2000)
);
GO

;WITH 
   L0 AS (SELECT 1 AS C UNION ALL SELECT 1)       --2 rows
  ,L1 AS (SELECT 1 AS C FROM L0 AS A, L0 AS B)    --4 rows (2x2)
  ,L2 AS (SELECT 1 AS C FROM L1 AS A, L1 AS B)    --16 rows (4x4)
  ,L3 AS (SELECT 1 AS C FROM L2 AS A, L2 AS B)    --256 rows (16x16)
  ,L4 AS (SELECT 1 AS C FROM L3 AS A, L3 AS B)    --65536 rows (256x256)
  ,L5 AS (SELECT 1 AS C FROM L4 AS A, L4 AS B)    --4,294,967,296 rows (65536x65536)
  ,Number AS (SELECT row_number() OVER (ORDER BY (SELECT 0)) AS N FROM L5) 
INSERT INTO dbo.TestData
SELECT
    N AS RowNumber,
    ABS(CHECKSUM(NEWID()))%1000000+1 AS SomeId ,
    REPLICATE('a',ABS(CHECKSUM(NEWID())) % 2000 + 1) AS SomeCode
FROM Number
WHERE [N] <= 50000
GO

UPDATE STATISTICS dbo.[TestData] WITH FULLSCAN;
GO

The first thing I want to illustrate is the average size of our SomeCode column.  We are using a CHAR(2000) data type; however, we are storing much less data than this on average. 

SELECT AVG(LEN(SomeCode)) AS AvgLen FROM dbo.TestData WHERE [RowNum] < 35000 
/*
AvgLen
-----------
997
*/

As you can see from the query above the average SomeCode length is 997 bytes; however, we are storing 2000 bytes per row.    This means we are consuming 50% more storage, per row.  Using a char data type is typically faster than using a VARCHAR data type; however, the cost of storing CHAR data types usually offset the performance gain.  If I were to choose a VARCHAR(2000) data type, I would consume less storage, which translates into faster table scans, smaller tables, faster backups, faster restores etc….  Performance will increase because less storage, is directly correlated to less pages.   The bottom line is less is faster.

The query I will be demonstrating returns a range of rows, where the sort order is different than the primary clustered key sort.  The IO stats will be the same across all variants of this query, so the counter will not illustrate a proper delta.  I will be using elapsed time to illustrate the delta between queries, with varying predicates. 

Let’s turn on STATISTICS TIME and NOCOUNT.

SET NOCOUNT ON;
GO
SET STATISTICS TIME ON;
GO

Now run the following query.  Make sure to make query results go to text. (Note: I assign columns to local variables to avoid results being printed).  Run the query a couple of times to warm the cache and get a baseline CPU and elapsed time.

DECLARE @RowNum INT,@SomeInt INT, @SomeCode CHAR(2000)
SELECT @RowNum = [RowNum], @SomeInt = [SomeId], @SomeCode = [SomeCode]
FROM dbo.[TestData]
WHERE [RowNum] < 3000 --3000 is in memory and 3500 sort in tempdb
ORDER BY SomeId

image

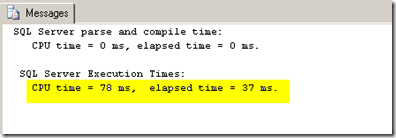
The query is very fast and performs within our SLA of 2 seconds.  Let’s see what happens when I increase the number of rows in the predicate to 3500.

DECLARE @RowNum INT,@SomeInt INT, @SomeCode CHAR(2000)
SELECT @RowNum = [RowNum], @SomeInt = [SomeId], @SomeCode = [SomeCode]
FROM dbo.[TestData]
WHERE [RowNum] < 3500 --3000 is in memory and 3500 sort in tempdb
ORDER BY SomeId

image

Wow… by returning 5000 more rows, the query is over 14 times slower!  You may be thinking that the speed difference is neglible, but on production systems the elapsed time delta can be quite extensive, at which point performance is a real problem.  Let’s check the execution plan for each query side by side.

image

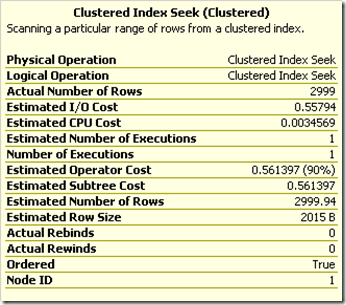
Well that is not much help….. both of our query plans look good.    There is really not much you can do to make the query perform better.  The index is doing a great job at returning the data., but that pesky sort is degrading performance.  The first thing I need to investigate is the detail of the query plan.The first query plan attribute I will look at is the clustered index seek estimated row size.  The estimated row size is derived from statistics and some internal calculations.   

image

The row size is estimated to be 2015 bytes for each row in the clustered index seek.  The row size is derived from native data types.  For example, we are using a CHAR(2000) and two integer columns.  This makes our row size 2000 (1 byte per char)+ 4 (int) + 4 (int) = 2008.  As you can see, 2008 is less than 2015.  The additional 7 bytes are associated to row overhead and the NULL bitmap.  The sort operator is also estimated a row size of 2015.  All of the estimates play a part in dictating how much memory will be granted to the query.  Next I am going to put the query into a while loop, so I can see the memory grants.  Open two new query windows and paste the below code.  Make sure to change the RowNum to 3000, in one of the query windows.  Take note of the session id of each of the windows.

WHILE 1 = 1
BEGIN
DECLARE @RowNum INT,@SomeInt INT, @SomeCode CHAR(2000)
SELECT @RowNum = [RowNum], @SomeInt = [SomeId], @SomeCode = [SomeCode]
FROM dbo.[TestData]
WHERE [RowNum] < 3500 --SWITCH OUT TO 3500 TO 3000
ORDER BY SomeId
END

In a completely new window, paste the below DMV query.  This query will return the memory grants for each of the sessions.  The key columns from this query are Max_Used_Memory and Granted_Memory.  If the Max and Granted memory are the same, it is likely that the query is consuming all the RAM granted to the query and the optimizer has to rely on tempdb to help with some operations.

SELECT [granted_memory_kb],[required_memory_kb],[max_used_memory_kb] FROM sys.dm_exec_query_memory_grants WHERE [session_id] = 56
SELECT [granted_memory_kb],[required_memory_kb],[max_used_memory_kb] FROM sys.dm_exec_query_memory_grants WHERE [session_id] = 60

All the execution plan details look fine, so I will dig a bit deeper into tempdb to unearth the real problem.  Let’s have a look at the tempdb IO stats to see if either query is using tempdb to perform any operations.

I will start by executing the “fast” query.

SELECT * FROM sys.[dm_io_virtual_file_stats](2,1)

--FAST
DECLARE @RowNum INT,@SomeInt INT, @SomeCode CHAR(2000)
SELECT @RowNum = [RowNum], @SomeInt = [SomeId], @SomeCode = [SomeCode]
FROM dbo.[TestData]
WHERE [RowNum] < 3000 --3000 is in memory and 3500 sort in tempdb
ORDER BY SomeId

SELECT * FROM sys.[dm_io_virtual_file_stats](2,1)
GO

image

The important columns to look at are num_of_reads, num_of_bytes_read, num_of_writes, num_of_bytes_written.  The number of reads and writes before and after the query are exactly the same.  This means the optimizer did not have to use tempdb operations.  Next, I will execute the slow query, which uses a predicate of less than 3500.

SELECT * FROM sys.[dm_io_virtual_file_stats](2,1)

--FAST
DECLARE @RowNum INT,@SomeInt INT, @SomeCode CHAR(2000)
SELECT @RowNum = [RowNum], @SomeInt = [SomeId], @SomeCode = [SomeCode]
FROM dbo.[TestData]
WHERE [RowNum] < 3500 --3000 is in memory and 3500 sort in tempdb
ORDER BY SomeId

SELECT * FROM sys.[dm_io_virtual_file_stats](2,1)
GO

image

By George…… I think we have something!!!  Why does the second query have more reads and writes into tempdb?  The answer is the sort operation is being done in memory for the “fast” query and the sort is being done in tempdb for the “slow” query.  Another method you can use to identify tempdb sort operations is Sort Warninigs.  When tempdb is used to perform sort operations the sort warnings counter will display it.  Below is a screenshot of the counter and the description.

image

Now that I have identified the problem, how do I solve it?  There are a couple of ways to solve this problem.  One solutions is to increase the estimated row size, so the optimizer grants more memory to the query, which in turn allows the sort to fit into memory.  The second option is to decrease the row size, so the sort fits into memory.   Let’s see this in action.

DECLARE @RowNum INT,@SomeInt INT, @SomeCode VARCHAR(2000)
SELECT @RowNum = [RowNum], @SomeInt = [SomeId], @SomeCode = CAST([SomeCode] AS VARCHAR(2000))
FROM dbo.[TestData]
WHERE [RowNum] < 3500 --3000 is in memory and 3500 sort in tempdb
ORDER BY SomeId

This method uses cast to convert the CHAR(2000) column to a VARCHAR(2000).  Casting the column to a VARCHAR(2000)   helps to reduce the estimated row size.  The estimated row size of a VARCHAR column is calculated as 50% of the total size.  The estimated row size is 50% of the VARCHAR column because 50% is a safe estimate because it really does not know how full the row is.  Generally speaking, VARCHAR columns never use 100% of a variable column anyway, so this helps SQL Server save resources. In our case, a VARCHAR(2000) is estimated to be approximately 1000 bytes.  Let’s have a look at the execution plan.

image

Unfortunately the conversion itself is not enough to optimize this query.  Let’s try to trim the CHAR column prior to the cast, so the row size is decreased.  The interesting thing here is the optimizer still reports the same estimated row size; however, the sort now occurs in memory.  This will help the sort fit into memory because the estimated row size is significantly less than 1019 for each row, so the optimizer is unintentionally giving extra memory to process this query.   Let’s see this in action.

DECLARE @RowNum INT,@SomeInt INT, @SomeCode VARCHAR(2000)
SELECT @RowNum = [RowNum], @SomeInt = [SomeId], @SomeCode = RTRIM(CAST([SomeCode] AS VARCHAR(2000)))
FROM dbo.[TestData]
WHERE [RowNum] < 3500 --3000 is in memory and 3500 sort in tempdb
ORDER BY SomeId

image

That’s  more like it.  If you run the query, with sys.dm_io_virtual_stats, you will see the query no longer uses tempdb to sort the rows.  This method works works well for queries where the predicate is < 3500.  If the returned range is significantly larger than 3500 rows, it is likely that the sort would spill into tempdb.  The idea here is to cater to every day usage patterns and let the exceptions take longer.  It should also be noted that if the CHAR(2000) column is nearly full for every row, the RTRIM method will not have the same impact.  When the RTRIM method is not cutting the mustard, it is time to go with another option…. such as bloating the estimated row size.

This is the solution presented in Ramesh’s webcast.  To do this we will use the same cast conversion, to introduce a compute scalar into the query plan, but this time we will make the value larger.  When choosing a larger number it is important to use a number that is not too large, as this could have an adverse effect on query performance, or other queries running on the server.  More information can be obtained via the webcast.

DECLARE @RowNum INT,@SomeInt INT, @SomeCode VARCHAR(4200)
SELECT @RowNum = [RowNum], @SomeInt = [SomeId], @SomeCode = CAST([SomeCode] AS VARCHAR(4200))
FROM dbo.[TestData]
WHERE [RowNum] < 3500 --3000 is in memory and 3500 sort in tempdb
ORDER BY SomeId
image 

Note: I am using SQL Server 2008 to perform my tests, but I have  tested both of these solutions in SQL Server 2005 and obtained similar results.

There you have it. I have done an introduction to performance tuning queries that seemingly have an ideal execution plan.  A lot of the concepts presented here were taken from http://sqlworkshops.com .  SQLWorkshops.com provides 3 webcasts that present a wealth of performance tuning tips that will benefit all levels of database professionals.  Stay tuned for my next post!!! I will be dissecting more query optimization techniques including two solutions to the TOP 101 challenge.

Until next time, happy coding.